


The Top 10 KPIs to track for 2026 beyond the Denial Rate
With the advancement in technology and AI driven tools into the healthcare industry the revenue cycle is becoming more challenging to manage each year. The rates of denials are also increasing steadily with one in every five claims being denied or delayed at least once. This rise isn’t just a billing inconvenience, but it reflects strained cash flow, increased administrative workload, and exposes deeper operational weaknesses across patient access, coding, and payer management. In order to survive and scale amidst these challenges hospitals and clinics must track the right KPIs, as the success of the Revenue Cycle Management (RCM) will no longer be defined by the number of clean claims submitted but by the efficiency, accuracy and profitability of those claims. For a high-performing organization tracking the denial rate alone is not sufficient, they must rely on a multi-layered KPI framework for measuring the front-end accuracy, mid-cycle integrity, and back-end cash performance in real time. These KPIs do more than indicating the performance, but they reveal the hidden bottlenecks, pinpoint revenue leakage, predict future denials, and show where exactly to intervene before the revenue is lost. If tracked consistently, these KPIs become the operational intelligence system making the entire RCM more efficient and profitable. This blog breaks down the top ten KPIs to track for the coming year 2026, why does each matter, how to interpret them and use these metrics to reduce denials, shorten A/R, and stabilize cash flow.
Why do KPIs matter more than ever in 2026?
The healthcare environment is changing rapidly with payers using AI-driven adjudication, stricter medical necessity rules, increased audits and patient payments making up 35–40% of the revenue. In this scenario, relying on monthly summaries or lagging indicators are not enough to protect the revenue. KPIs serve as the early-warning system to the revenue cycle, exposing bottlenecks before they turn into write-offs. They enable proactive decision-making for adjusting the workflows, strategically allocating the resources, and prioritizing high-risk claims.
We at Shoreline Healthcare Technologies have embedded KPI monitoring directly into our daily operations through real-time dashboards, payer analytics, and automated alerts. Thereby helping hospitals and clinics identify the breakdowns in their front-end accuracy, documentation, coding, and payer follow-up before the issues turn into denials, delayed payments, or write-offs. By partnering with us healthcare organisations can see a visible improvement in clean claim rate, first-pass acceptance rate, and touchpoints per claim with increased operational efficiency and claim quality.
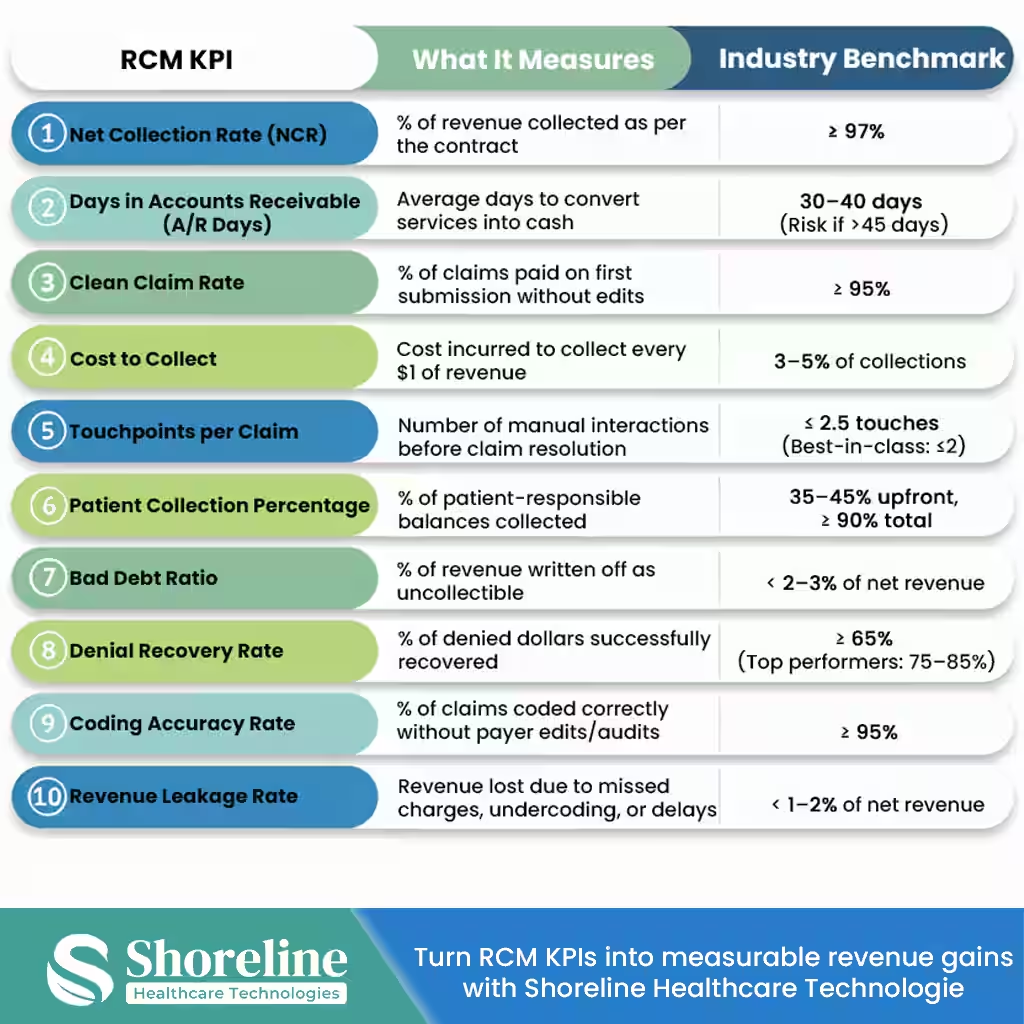
The KPIs to track
1.Net Collection rate
It measures the percentage of revenue that is collected after the contractual adjustments. In simple terms NCR removes the unrealistic expectations and focuses on the legitimate payable amount.
Net Collection Rate is a revenue integrity KPI, that reflects the combined effectiveness of:
- ➢ Contract management
- ➢ Claim accuracy
- ➢ Denial prevention and appeals
- ➢ Payment posting accuracy
- ➢ Follow-up discipline
A strong NCR indicates a high-functioning, controlled revenue cycle. A weak NCR signals silent revenue loss.
How does it affect RCM?
A declining NCR often signals underpayments, claims written off prematurely, missed appeal opportunities, they also expose whether the fee schedules are loaded correctly and the payments align with the contract terms as certain payers consistently underpay. Even a small drop in the NCR can result in considerable amount of revenue loss.
At Shoreline Healthcare Technologies we have built a payer-specific NCR dashboards, for tracking and reconciling the allowed amounts against each payment posted with automated flagging of underpayments. Our team also follow up and review the payer contracts for every quarter for any changes in the contractual amount. We keep monitoring the trends across the payers that helps us to detect the revenue loss at the very early stages.
2.Days in Accounts Receivable (A/R Days)
Days in A/R represents the average number of days the outstanding claims remain unpaid after the date of service. It reflects the operational efficiency across the entire revenue cycle, from front-end accuracy till payer follow-up and payment posting.
How does longer A/R Days affect an organization?
Higher days in AR directly impacts the cash flow forcing the organizations to rely on credit lines and delay their investments. It exposes the workflow inefficiencies like coding delays, authorization issues, incomplete documentation and ineffective follow-up. Claims sitting in A/R too long can face timely filing expirations, reduce the success rates of appeals and have higher likelihood of write-offs.
We at Shoreline Healthcare Technologies have implemented
- ➢ The real-time A/R aging dashboards by categorizing them into A/R aging buckets (0–30, 31–60, 61–90, 90+ days) along with payer-wise & specialty-specific A/R distribution.
- ➢ Priority queues for high-value and high-risk claims.
- ➢ Early escalation for aging claims approaching filing limits
Rather than treating A/R as a backlog, we manage it as a time-sensitive asset that helps us to have faster cash conversion and reduced write-offs.
3. Clean Claim Rates (First-Time Acceptance)
It is also called as the First-Pass Yield (FPY) is one of the most actionable KPIs in Revenue Cycle Management. It measures the percentage of claims that are paid correctly on the very first submission, without any rework, edits, or denials.
How does Clean Claim Rate Affects the Revenue Cycle?
Claims paid on the first submission reduces the payment delays and accelerates cash flow compared to corrected claims, it reduces the rework and labor costs required for manual review, corrections, resubmission and follow-up. Most of the denials begin as an avoidable error due to incorrect patient data, missing modifiers, invalid codes, or authorization gaps by improving the clean claim rate we can prevents these denials upstream.
Clean Claim Rate is a core KPI that is actively tracked by Shoreline Healthcare Technologies. All claims are scrubbed using payer-specific rules before submission, we have implemented API driven real-time eligibility and coverage validation, along with modifier and NCCI edit checks. Our specialty-specific coding audits and clearinghouse rejection trend analysis have helped us to ensure that claims are accurate before they reach the payers.
4. Cost to Collect
It represents the percentage of revenue spent on billing, collections, staffing, and other RCM operations. It shows how much it costs for the organization to collect for every dollar of revenue and focuses on how efficiently that revenue is collected.
What are all the operating cost that must be considered?
RCM operating costs must include all expenses that are required to bill, collect, and manage the revenue, not just the billing & A/R staff salaries. It should typically cover the cost for billing and analytics technology, expenses for outsourced billing or coding vendors, compliance and audit activities, training, clearinghouse and software fees and other expenses for the technology.
Shoreline Healthcare Technologies have implemented workflow automation to reduce the repetitive manual labor, our AI-driven tools prioritize claim and avoids the need for rework. Our approach ensures sustainable and compliant cost improvements alignment with the payer rules.
5. Touchpoints per Claim
It measures the number of human actions required to get the claim paid, that is the number of times a claim is manually worked before the final resolution. So fewer touchpoints mean higher efficiency, lower cost, and faster cash flow.
How should the providers track the Touchpoints per Claim?
An effective tracking of the touchpoint requires transparency in the workflow. Providers should continuously monitor every manual action taken on a claim from submission to final payment. This might include edits, resubmissions, payer follow-ups, appeals, and payment corrections, that can be captured through claim activity logs in the PM/EHR or workflow management system. For meaningful insight, touchpoints should be analyzed by payer, denial reason, and specialty, and reviewed regularly to identify the repetitive rework and workflow inefficiencies.
At Shoreline Healthcare Technologies workflows are designed to minimize human touches, all claims are routed intelligently and escalated only when intervention is required.
6. Patient Collection Percentage
This metric measures the percentage of the patient-responsible balance collected by the provider either upfront or after billing such as copays, deductibles, and coinsurance.
How does Patient Collection Percentage affects RCM?
With the growth of high-deductible health plans, patient responsibility contributes to a significant share of the provider revenue. Unlike payer balances, patient balances are harder to collect over time and are more likely to turn into bad debt and write-offs.
Shoreline’s Virtual Assistants supports providers by clearly communicating the patient’s responsibility right at the time of appointment scheduling, they send payment reminders, and make timely follow-ups across calls, messages, and portals helping organizations to collect the balances earlier in the billing cycle. Read our case study to understand how our team combined payer negotiations with patient outreach workflows to recover significant outstanding balances, including nearly $800,000 collected through patient follow-ups. This illustrates how proactive collections would support the overall financial recovery resulting in higher patient collection percentages., At Shoreline we have integrated eligibility checks, upfront estimates, POS workflows and payment options to improve patient payment realization.
7. Bad Debt Ratio
It shows the percentage of revenue written off as uncollectible after reasonable collection efforts. This metric is a direct indicator of front-end accuracy and patient financial engagement.
What are the best practices for providers to track the bad debt ratio?
Providers should have a clear financial classification that distinguishes bad debt from contractual adjustments, charity care, and timely filing write-offs. They should have a monthly and quarterly track of the bad debt segmenting it by payer type, location, and specialty to identify root causes. Keep monitoring the self-pay aging before write-off and enforce a standardized write-off timeline.
8.Denial Recovery Rate
Denial Recovery Rate measures the amount of revenue collected after a denial through successful corrections and appeals. Unlike the denial rate that shows rate of claims denied, this KPI shows how effective the organization is at winning the revenue back.
A strong denial recovery rate indicates
➢ Effective denial prioritization
➢ Timely, payer-specific appeals
➢ Accurate documentation and coding
➢ Disciplined follow-up processes
Shoreline Healthcare Technologies is expert in handling the denials, our AI driven denial root-cause analytics are created with category-level dashboards, with payer-specific appeal workflows and templates automated for appeal deadline tracking ensures the collection of denied revenue before the closure of the recovery windows.
9. Coding Accuracy Rate
Coding Accuracy Rate measures the correctness of the coded medical claims the very first time, without payer edits, downcoding, denials, or audit findings. It’s a cornerstone KPI for revenue integrity and compliance and a leading indicator of audit risk.
Shoreline Healthcare Technologies have a team of certified, specialty-aligned coders to handle payer specific edits. We conduct random and targeted audits (by payer, specialty, provider) every month to track the error type (CPT/HCPCS selection, modifiers, diagnosis linkage) and have separated the documentation errors from coding interpretation errors. This would help to improve the accuracy and maintain compliance.
10. Revenue Leakage Rate
It measures the percentage of earned revenue that is lost due to process gaps across the revenue cycle like missed charges, undercoding, untimely filing or unworked denials. It represents the portion of net revenue that fails to convert into cash, despite the services being delivered and documented.
At Shoreline we conduct quarterly revenue leakage assessments to focus on the charge capture reconciliation workflows, contract vs payment variance analysis, denial closure quality checks and timely filing risks to stop the silent revenue loss.
In the coming years Revenue Cycle Management will be defined by the accuracy of data, automation, and speed. Hospitals and clinics who have started to track the right KPIs, acting on them early by aligning their clinical, financial, and administrative workflows will outperform the competitors even under the shrinking environment. And with performance-driven RCM partners like Shoreline Healthcare Technologies, organizations aren’t just tracking numbers but transforming them into predictable cash flow by lowering their denials for a long-term financial stability.
FAQs
Q1. How does the Coding Accuracy Rate affect the Revenue Cycle?
+Coding accuracy directly affects the reimbursement levels, increases denial volume, exposes the practices to audit and recoupments, reducing the Net Collection Rate and revenue leakage. It may cause compliance risk.
Q2. What are the common errors that should be avoided while tracking on the bad debt ratio?
+Providers should avoid classifying the contractual adjustments or eligibility-related denials as bad debt. Writing off balances too early without adequate follow-up can also inflate the ratio and hide process gaps.
Q3. How frequently does Shoreline track the Clean Claim Rate?
+At Shoreline we perform daily monitoring of clearinghouse rejections, with weekly tracking of claims by payer and specialty types. Every month we perform denial trend reporting for corrective action plans that have yielded us with more than 96% of First-Pass Acceptance rate.
Q4. How does Shoreline Healthcare Technologies help to turn KPIs into Cash Flow?
+We at Shoreline Healthcare Technologies provides real-time KPI dashboards that tracks daily operational performance, with payer-specific analytics. We have also enabled AI and automation in our workflows that have helped us to optimize our performance and always stay aligned with compliance for a profitable RCM governance.

Sharanya Rajmohan
Content Writer
Sharanya brings clarity to the complexities of medical billing and healthcare regulations. With a knack for turning industry shifts into straightforward, actionable insights, her blogs help readers stay informed without the jargon.


Partner with Shoreline Healthcare Technologies for a futuristic management of your Revenue Cycle.